
Portfolio Insights and Renewal Forecast
Recurring spend, portfolio health and the next six months of renewals, computed from your own subscriptions rather than typed in.
These images are illustrations of the concept, not screenshots of the actual product.
Overview
Portfolio Insights is the analytics surface of Subscriber Bot: the place where a list of subscriptions turns into a picture of where recurring money goes, what renews next and what deserves a second look. This concept illustrates it across two screens — an insights page that summarizes and connects the whole portfolio, and a renewals and cashflow view built around the coming months.
Most people can name a few of their subscriptions but cannot state a monthly total, and almost nobody can say which month ahead is the expensive one. Renewal dates sit in scattered confirmation messages, prices drift between cycles, and trials convert quietly. The design answers that by deriving every figure from the portfolio itself and normalizing mixed billing cadences to a monthly equivalent, so annual, quarterly and monthly commitments can be compared in a single view. The page text says as much directly beneath the title.
The insights page opens with four summary tiles — recurring spend per month, active subscriptions, how many renew inside thirty days, and an average health score — with the renewal tile tinted as an attention state. Below them, a donut breaks the portfolio into active, trialing, past due and cancelled counts; a bar list splits monthly spend across subscriptions, licenses, memberships and contracts; and a six-month forecast lists each upcoming month with a bar and a projected amount. A relationship graph panel then draws the same data as connected nodes — a subscription linked to its provider, its plan, the invoices billed for it and the agent watching it — with labeled edges and a legend, so overlaps and dependencies are visible rather than inferred.
The renewals and cashflow screen narrows the same material to timing and money. A projected recurring spend chart covers the next six months, a highlighted panel lists trials ending soon with days remaining, and a table groups upcoming renewals by month with a name, date and amount, each row offering a reminder or a review.
Insights reads from the relationship records rather than replacing them: the action lists at the foot of the page hand off to the subscription itself, the optimization rows lead into the spend optimization work, and the agents that watch renewals draw on the same figures. It is the reporting layer over everything the portfolio already knows.
What this concept shows
- Summary tiles for monthly recurring spend, active subscriptions, renewals due within thirty days and an average health score
- A portfolio-by-status donut counting active, trialing, past due and cancelled records against a total
- Monthly spend split by relationship type — subscription, license, membership and contract — as a labeled bar list
- A six-month renewal forecast listing each month with a proportional bar and a projected amount
- A relationship graph drawing providers, plans, invoices and agents as connected nodes with labeled edges and a legend
- An optimization opportunities list and an upcoming renewals action list, each row carrying its own follow-up action
- A projected recurring spend chart, a trials-ending-soon panel with days remaining, and a renewals table grouped by month
- Per-row reminder and review actions on every upcoming renewal
How it works
- Open Insights from the main navigation to see recurring spend, active count, near-term renewals and average health in one row of tiles.
- Read the status donut and the spend-by-type bars to see how the portfolio is distributed and which kind of commitment dominates.
- Scan the six-month forecast to find the months that carry the heaviest renewal load.
- Explore the relationship graph to see how a subscription connects to its provider, plan, invoices and the agent watching it.
- Work the optimization and renewal action lists at the foot of the page, or move to the renewals and cashflow view for a month-by-month table.
- In that view, check trials ending soon and set a reminder or open a review on any renewal that needs a decision.
Who it's for
- Individuals who want one honest number for their monthly recurring spend
- Finance and operations leads forecasting renewal load by month
- Procurement and vendor managers reviewing portfolio health before a renewal window
- Founders and small teams deciding what to keep before the next billing cycle
Illustrations
2 illustrations of this concept. Select one to view it full size.
Insights Page with Spend Tiles and Relationship Graph
A dark desktop layout with the main sections — overview, relationships, providers, universal inbox, invoices, AI agents, workflows, insights and asset vault — in a left rail, and a context switcher, search field, notifications and a theme toggle across the top. The Insights page explains beneath its title that the figures are aggregated from the portfolio and normalized to a monthly equivalent. Four tiles show recurring spend per month, active subscriptions, renewals inside thirty days in an amber attention state, and an average health score. Beneath them sit a portfolio-by-status donut with active, trialing, past due and cancelled counts, a bar list of monthly spend by relationship type, and a six-month forecast of projected amounts. A graph panel draws one sample subscription linked to its provider, plan, three monthly invoices and a renewal agent, with labeled edges and a node legend. Two action lists close the page: optimization opportunities and upcoming renewals, each row carrying its own button.
Renewals and Cashflow Forecast
A light desktop view titled for renewals and cashflow forecasting, with a narrow side rail offering overview, cashflow, trial alerts, renewals and settings, and the renewals section selected. The main heading is followed by a savings pill and a control for editing terms. A large card charts projected recurring spend across the next six months as paired bars per month, so the shape of the load is visible without reading values. Below it, a highlighted panel lists trials ending soon, each row naming a sample service and the days remaining before it converts. On the right, a table with name, date and amount columns groups upcoming renewals under month headings, and every row offers a reminder action alongside a review action. A small floating card summarizes the total renewing in the current month. All names and figures shown are illustrative sample data.
Topics
- subscription analytics
- recurring spend dashboard
- renewal forecast
- subscription cashflow projection
- trials ending soon
- subscription health score
- monthly spend by category
- subscription relationship graph
- upcoming renewals list
- portfolio by status
Related concepts
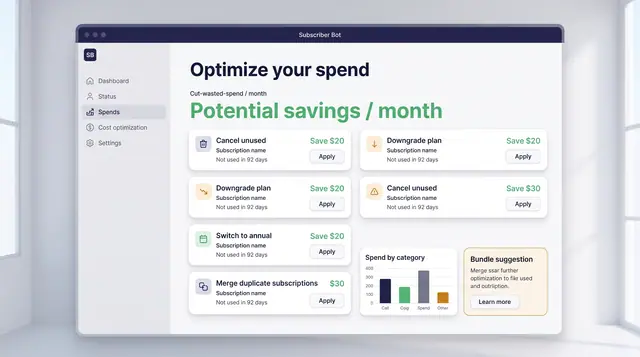
Spend Optimization and License Utilization
Turn portfolio data into decisions: cancel what is unused, downgrade what is oversized, and find the seats you are paying for twice.
2 illustrations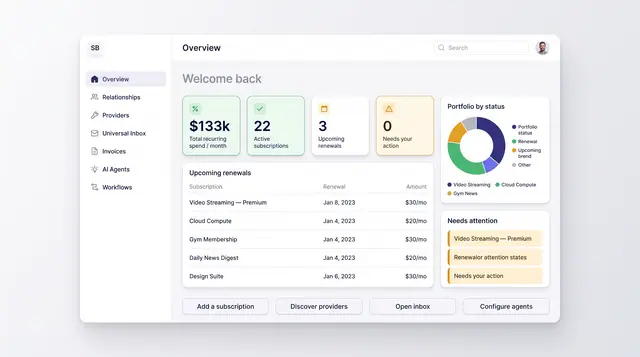
Portfolio Overview Dashboard
One home screen for recurring spend, active subscriptions, upcoming renewals and anything that needs your attention.
2 illustrations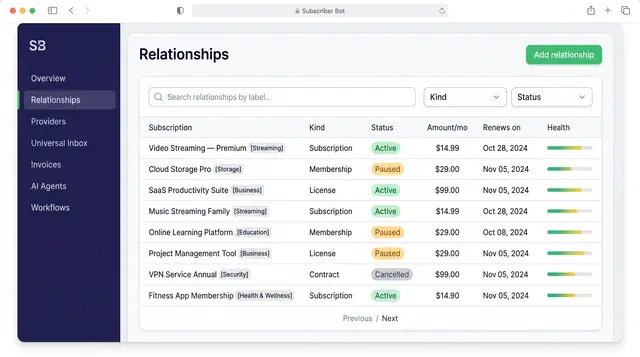
Subscription Relationships
Every subscription, membership, license and contract as one record with its plan, payment, entitlements, health and renewals.
3 illustrations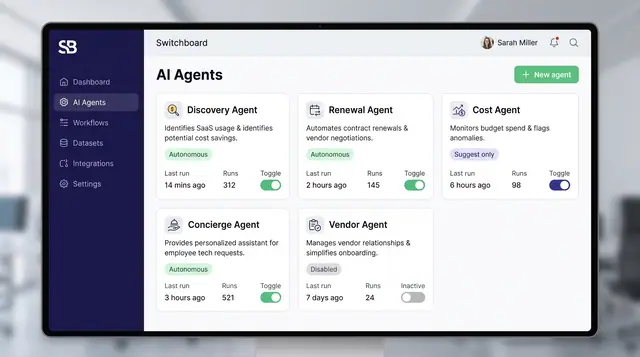
Governed AI Agents and Autonomy Controls
Specialized agents watch your portfolio and propose actions, while posture settings, policies and interlocks decide what they may do alone.
4 illustrations