
Spend Optimization and License Utilization
Turn portfolio data into decisions: cancel what is unused, downgrade what is oversized, and find the seats you are paying for twice.
These images are illustrations of the concept, not screenshots of the actual product.
Overview
Spend Optimization is where Subscriber Bot stops reporting and starts recommending. Knowing the monthly total is useful; knowing which four subscriptions to cancel, downgrade, move to annual billing or merge is what actually changes the number. This concept illustrates two views of that idea — a personal optimization page built around savings suggestions, and a license management view built for a finance or procurement team tracking seats across an organization.
The waste in a subscription portfolio is rarely dramatic. It is a plan bought for a project that ended, a tier sized for a bigger team, two tools that overlap, a monthly cadence on something that would be cheaper annually, and seats assigned to people who never signed in. None of that is visible from a bank statement, and none of it surfaces unless something compares usage against cost and keeps doing so.
The personal view leads with potential savings per month and then lists the individual suggestions behind that figure as cards. Each card names the action — cancel an unused subscription, downgrade a plan, switch to annual, merge duplicate subscriptions — alongside the subscription it applies to, the evidence for the recommendation such as no recorded use in the past ninety-two days, the amount it would save, and an apply button that turns the suggestion into a change. A small spend-by-category chart and a bundling suggestion sit alongside, so a recommendation can be read in the context of the whole portfolio.
The license view scales the same reasoning to an organization. Summary tiles carry total annual spend, active license count, the share of seats actually used, and how many agreements renew next quarter. A departmental spend chart shows where the money is concentrated, an alert calls out vendors whose tools overlap, and a license table lists each application with its owning department, seats assigned against seats used, a utilization bar, annual cost and renewal date — so an oversized contract is visible as a short bar rather than as a line item.
Both views depend on the portfolio being complete: they compute from the same relationship records, invoices and usage that the rest of the product tracks, and hand any accepted recommendation back to the subscription it came from.
What this concept shows
- A potential-savings-per-month headline built from the individual recommendations listed beneath it
- Recommendation cards for cancelling unused subscriptions, downgrading plans, switching to annual billing and merging duplicates
- Evidence on every card, such as no recorded use over the last ninety-two days, plus the amount each action would save
- An apply action on each recommendation so a suggestion can be turned into a change in place
- A spend-by-category chart and a bundling suggestion for reading recommendations in context
- Organization tiles for annual spend, active licenses, share of seats used and renewals due next quarter
- A duplicate vendor alert that names the overlapping tools
- A license table with owning department, seats assigned against seats used, a utilization bar, annual cost and renewal date
How it works
- Open the optimization view to see the potential monthly saving and the recommendations that make it up.
- Read a card to see which subscription it concerns, what action is proposed and what evidence triggered it.
- Apply the recommendation, or leave it and compare it against the spend-by-category chart first.
- For an organization, switch to the license view and check the tiles for annual spend, seat utilization and renewals due next quarter.
- Scan the department chart and the duplicate vendor alert to find overlapping tools before a renewal comes up.
- Work down the license table, using the utilization bars to find agreements with more seats assigned than used, and act before the renewal date in the last column.
Who it's for
- Individuals cutting unused or duplicated recurring spend
- Finance teams accountable for software cost per year
- Procurement and vendor managers consolidating overlapping tools
- IT and operations leads reclaiming unused seats before renewal
- Team leads who own a departmental software budget
Illustrations
2 illustrations of this concept. Select one to view it full size.
Optimize Your Spend Recommendations
A light application window with a side rail offering dashboard, status, spends, cost optimization and settings, with the spends section selected. The page is headed for optimizing spend and leads with a large potential-savings-per-month figure in a positive green treatment. Beneath it, a two-column grid of recommendation cards each pairs an icon with an action title — cancel an unused subscription, downgrade a plan, switch to annual, merge duplicate subscriptions — a placeholder line for the subscription name, a reason line noting it has not been used in ninety-two days, the saving the action would produce, and an apply button. A compact spend-by-category bar chart sits in the lower area beside a highlighted bundling suggestion with a link to read more. Every name and figure on the page is illustrative sample data.
License and Seat Utilization for a Team
A light page shown on a tablet-style device in landscape, with dashboard and licenses in the side rail and a team context switcher in the header. The heading covers software spend management, followed by four tiles: total annual spend, active license count, the percentage of seats utilized and the number of renewals due next quarter. A department spend chart plots six short-labeled columns against a value axis, and an amber alert overlaps its right edge to report that duplicate vendors were detected, naming the overlapping tools. Below, a license table lists applications with columns for the owning department, seats assigned, seats used, a colored utilization bar, annual cost and renewal date; healthy rows show green bars while under-used ones show shorter amber bars. Application names and figures are illustrative sample data.
Topics
- subscription cost optimization
- SaaS spend management
- license utilization
- unused subscription detection
- duplicate vendor consolidation
- downgrade plan recommendation
- switch to annual billing savings
- seat utilization report
- software renewal planning
- cut recurring spend
Related concepts
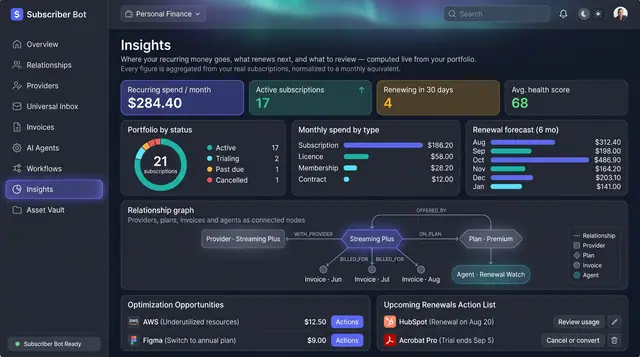
Portfolio Insights and Renewal Forecast
Recurring spend, portfolio health and the next six months of renewals, computed from your own subscriptions rather than typed in.
2 illustrations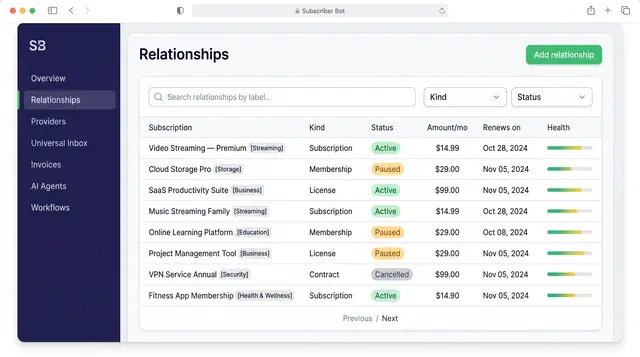
Subscription Relationships
Every subscription, membership, license and contract as one record with its plan, payment, entitlements, health and renewals.
3 illustrations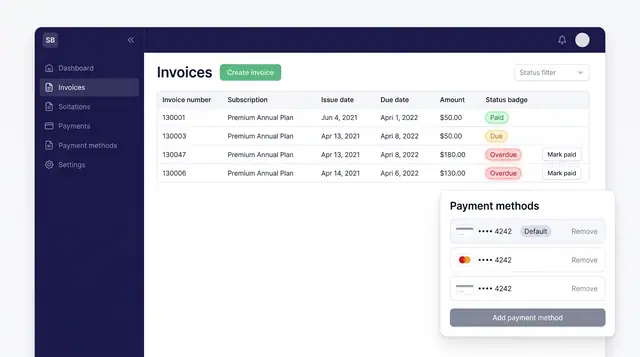
Invoices and Payment Methods
Track every subscription invoice by status and keep the cards that pay for them in one place, with a clear default.
1 illustration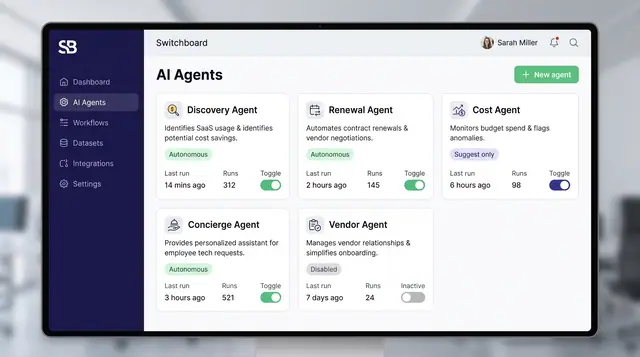
Governed AI Agents and Autonomy Controls
Specialized agents watch your portfolio and propose actions, while posture settings, policies and interlocks decide what they may do alone.
4 illustrations
Part of industry solutions
This concept appears in cross-product solutions on burdenoff.com — see how it works alongside other Burdenoff products to solve a problem in that industry.

Industry solution
Family & Home Life
Turns unused and duplicated plans into concrete cancel, downgrade, merge and switch-to-annual proposals, each showing its monthly saving before anyone applies it.
See the solution(opens in a new tab)
Industry solution
Personal Finance
Turns the recurring register into decisions: cancel what is unused, merge duplicates and downgrade what is oversized, which is where the second storage plan and the idle seat surface.
See the solution(opens in a new tab)